Archives
now browsing by author
ADA – What, When and Why?
What is the Americans with Disabilities Act?
The Americans with Disabilities Act (ADA) is Federal civil rights legislation designed to provide equal rights to people with disabilities as those enjoyed by the able-bodied.
When was the ADA Enacted?
The ADA was signed into law by President George H. W. Bush on July 26, 1990 and it was subsequently amended in 2008. The Amendments became effective on January 1, 2009.
Why was the Americans with Disabilities Act Passed?
Congress determined that people with mental and physical disabilities were entitled to participate in all aspects of society but found that many individuals had been discriminated against in areas such as:
- employment;
- housing;
- public accommodations;
- transportation;
- communication;
- access to public services;
- and more.
The purpose of enacting the ADA was to:
(1) provide a national mandate for the elimination of discrimination against individuals with disabilities;
(2) to provide clear, enforceable standards to address discrimination against people with disabilities;
(3) to have the Federal Government play a central role in enforcing the standards against such discrimination.
Why was the ADA Amended?
By 2008 Congress found that the Americans with Disabilities Act of 1990 (ADA) was not being interpreted and enforced by the Courts in the way Congress intended. They found that discrimination against people with disabilities persisted and enacted amendments to the ADA to improve the consistent enforcement of the standards.
The ADA is divided into Titles I, II, III and V as follows:
- Title I – Employment;
- Title II – Public Services;
- Title III – Public Accommodations and Services Operated by Private Entities (The focus of these questions and answers);
- Title V – Miscellaneous Provisions.
Congress determined that “No individual shall be discriminated against on the basis of disability in the full and equal enjoyment of the goods, services, facilities, privileges, advantages, or accommodations of any place of public accommodation by any person who owns, leases (or leases to), or operates a place of public accommodation.”
I will be providing a series of articles describing how the ADA affects Places of Public Accommodation in an attempt to distill the key requirements of the ADA and offer suggestions for owners, tenants, operators and property managers about making modifications that will enable their business to be accessible to all people.
The information provided in this article is based upon my review of the Americans with Disabilities Act, The 2010 Accessibility Guidelines, the Americans with Disabilities Act Title III Regulations. And the Title III Technical Assistance Manual. It describes what I have found to be the most common issues encountered during my ADA investigations. For a more complete review of the Americans with Disabilities Act (ADA) please refer to the law, regulations and standards referenced, herein.
Return to Frequently Asked Questions
NJ Land Surveyors Elect Carl E. Peters as President
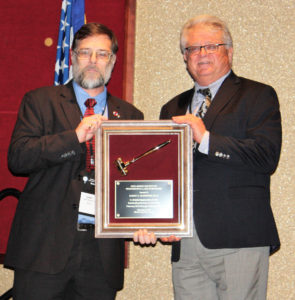
2017 NJSPLS President, Carl Peters, PLS, PE, right, presents outgoing President Barry Gleissner a plaque honoring his two years of service.NJ Land Surveyors Elect Peters President for 2017
NJ Land Surveyors Elect Peters President for 2017
On February 2, 2017, Carl E. Peters, PLS, PE, PP became the President of the New Jersey Society of Professional Land Surveyors (NJSPLS). Peters took over from Barrry Gleissner, PLS who served the organization as president for the past two years.
The transition occurred at SurvCon 2017, NJSPLS’s annual conference. Approximately 800 surveying professionals attended SurvCon where continuing education courses are offered over a three day period.
Purpose
The purpose of NJSPLS shall be to maintain and perpetuate an organization for members having common professional problems and interests, to provide effective forums for discussion and united action on the part of its members, for the enhancement and betterment of professional recognition, and for other matters of common welfare.
Objectives
Among the objectives of NJSPLS are:
- Promoting and maintaining high standards of professional ethics and practice.
- Promoting uniformity of practice.
- Discouraging unethical and illegal practices and professional abuses in land surveying.
- Promoting public understanding, faith, and reliance in the land surveyors and their work.
- Advancing the study of land surveying and education of land surveyors
- Establishing better relations between the land surveyors and other professions.
NJ Land Surveyors Scholarship Foundation
NJSPLS scholarships are available for students who are pursuing a career in land surveying. Applicants must be New Jersey residents studying in a Bachelor’s or Master’s degree in Land Surveying or a related field. Some of the recent NJSPLS scholarship recipients have been full time students while others are getting their education while working full time. The NJ Land Surveyors organization offers these awards on an annual basis. Award recipients may continue to apply during their academic career.
Opportunities in Land Surveying
One of the societies current goals is to inform the public about the practice of Land Surveying and to inform young people of the opportunities for well paying careers as a Professional Land Surveyor but also as a technician performing field measurements or computer mapping services.
Carl E. Peters Receives NJ Municipal Engineers Award
On Wednesday, November 16, 2016, Carl E. Peters, P.E., P.L.S, P.P, C.O received the New Jersey Society of Municipal Engineers (NJSME) award for distinguished service, Todd Hay, P.E., President of NJSME, presented the recognition at the society’s annual luncheon at the New Jersey State League of Municipalities Conference in Atlantic City.

NJ Society of Municipal Engineers Awards luncheon November 2016. Pictured from left are Kimberli Craft, PE, Carl Peters, PE, PLS and Todd Hay, PE
Peters, who is Past President of the statewide municipal engineering group, was honored for his: “Outstanding contribution as author of the NJSME ‘Analysis of NJ’s Municipal Road Repair Needs’ … and publishing the report as the State addressed TTF (Transportation Trust Fund) reform”.
He is pictured at left with 2016 NJSME President Todd Hay, PE and incoming president Kimberli Craft, PE.
Peters, who was the NJSME president in 2007, was the Municipal Engineer for the former Borough of Princeton from 1984 – 2007. He has remained active with the New Jersey Society of Municipal Engineers since leaving public employment. He has served on both the Executive Committee and Advisory Board and is also an instructor in the society’s Certified Municipal Engineer (CME) program.
Peters provides training to professional engineers about New Jersey’s Municipal Land Use and Construction Code regulations. His class is part of a ten day program of courses developed by NJSME. The program’s mission is to educate engineers about the broad range of topics required to practice as a municipal engineer.
Peters is currently in private practice with an office in Fords, NJ. He provides consulting services in the areas of land use, construction code analysis, handicapped (ADA) access and litigation support.
“Local Street Repair Cost” Paper at 2017 TRB Meeting
Peters, Peters and Gordon to present paper at TRB
Carl E. Peters, P.E., and co-authors Jonathan R. Peters, Ph.D. and Cameron Gordon, Ph.D. will be presenting their paper “Who should pay for the local street? Who does? A survey of New Jersey municipalities” at the annual meeting of the Transportation Research Board in Washington, DC, in January 2017.
About TRB
According to its website, The Transportation Research Board (TRB) “is one of seven program units of the National Academies of Sciences, Engineering, and Medicine, which provides independent, objective analysis and advice to the nation and conducts other activities to solve complex problems and inform public policy decisions.”The mission of the Transportation Research Board (TRB) is to promote innovation and progress in transportation through research.”
How Much Does It Cost to Maintain New Jersey’s Local Streets?
The paper, which is based upon a study the team performed for the New Jersey Society of Municipal Engineers, quantifies the cost to keep New Jersey’s local streets in good repair. The report establishes the cost to maintain an average mile of a local street in New Jersey for a sixty year life span, It then projects the annual repair repair cost for all municipally maintained roads by multiplying the cost per mile by the total length of streets in municipal jurisdiction. The resulting annual need is a staggering $1.2 billion.
How is Transportation Funded in New Jersey?
The paper includes an analysis of the current revenue sources available for the upkeep of municipal streets, along with State and County roadways and New Jersey Transit.
The New Jersey Department of Transportation (NJDOT) 2010 listing of roadway mileage by jurisdiction shows that approximately 29,000 of the state’s 39,000 miles of roadway’s are maintained by municipalities. In 2014, State and Federal Aid to municipalities for local street repairs was less than $100 million. The remaining revenues to fix local streets must come from municipal budget sources, primarily property taxes.
Are Current Funding Methods Fair?
The paper raises the question “Who benefits from local streets?” as well as “Do all of the parties that benefit from local streets pay their fair share of maintenance costs?”
Only about 3% of New Jersey’s Transportation funding from state and federal sources is distributed to municipal governments.(see graph below for the period 2006 -2016),
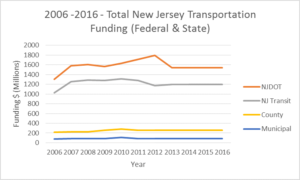
NJ Transportation Funding 2006 -2016
New Jersey Department of Transportation records indicate that in 2014 approximately 15% of average daily traffic was carried by local streets.
The network of New Jersey’s municipal roads is extensive. Most vehicular trips have either an origin or destination on a local street. Local streets serve emergency services, commerce and other regional travel. Municipalities must maintain over 70% of New Jersey’s road mileage. These local streets carry over 15% of the vehicular trips per day. While noting that State and County roads are generally wider and carry larger volumes of truck traffic, it appears that New Jersey’s municipalities are being shortchanged when it comes to the distribution of funds for transportation.
What does the future hold for funding of local street repairs?
This paper has identified that we have much work to do to address efficient funding for local streets, sidewalks and curbs in particular. It is clear that the deferred maintenance and ongoing investment challenges are extensive and that the funding gap is massive. Yet these needs are largely ignored on the state and federal level; thus these costs and problems are left to the local governments. Like many state and federal unfunded mandates, the local governments then have to struggle to find funding sources to address problems that are not always just local in scope.
New Jersey League of Municipalities Conference 2016
Carl E. Peters will be attending the New Jersey League of Municipalities Conference in Atlantic City on Nov. 15 – 18, 2016 as a representative of the New Jersey Society of Municipal Engineers (NJSME) and the New Jersey Society of Professional Land Surveyors (NJSPLS). Peters is currently President-Elect of NJSPLS and a member of NJSME’s Executive Committee.
On Tuesday afternoon Carl will be manning the NJSPLS booth #1803. Please stop by to discuss any land surveying questions that you have.
On Wednesday, Carl will be participating in an assortment of NJSME functions including: the Past President’s breakfast, the annual business meeting, the awards luncheon. At 2:30, in Room 313, he will be attending a joint meeting of NJSME and the Institute of Local Government Attorneys – an annual program which always sparks a lively discussion. He will conclude the day ant the annual meeting of the NJ Planning Officials in Room 314.
A discussion of Change Orders, Contract Closeout and Bid Documents will be held at 10:45 in Room 309 at a joint meeting of NJSME and the Governmental Purchasing Association of NJ.
Please e-mail me at cpeters@carlepeters.com if you will be attending the conference and would like to chat.
NJ Municipal Road Repairs – Where’s the Money?
Municipal road repair needs are staggering
New Jersey’s municipalities need help. They’re in need of an adequate, steady source of funding for their road repairs. A recent report prepared for the New Jersey Society of Municipal Engineers estimates the annual need for municipal road repairs at almost $1.3 billion. New Jersey’s municipalities, who are constrained by a 2% tax cap, cannot adequately maintain their streets without both more funding from the Transportation Trust Fund (TTF) and a more equitable way of sharing those revenues with the counties.
On June 23, 2016 committees of both the New Jersey Senate and Assembly approved bills to provide new revenues for the New Jersey Transportation Trust Fund which supports Department of Transportation (NJDOT), New Jersey Transit (NJT) and County and Municipal road, bridge and mass transportation projects. Providing the capital to maintain the state’s transportation infrastructure is vital to New Jersey’s economic health
Local Aid to Municipalities is Meager
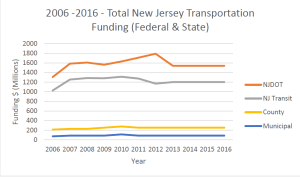
Unfortunately for Municipalities, they are at the end of the line when it comes to distribution of revenues from the Transportation Trust Fund. For the past ten years New Jersey Municipalities have received only about 3% of the state’s transportation funding (see graph below).
This fact is especially troubling to local Mayors, Administrators and Engineers who are responsible for the maintenance of New Jersey’s more than 29,000 miles of municipal roadways representing 75% of the centerline road miles in the entire state.
New Jersey’s Centerline Miles of Roads based upon 2010 NJDOT Inventory
- NJDOT 2,323 = 6%
- Authority 411 = 1%
- County 6,449 = 17%
- Municipal 29,408 = 75%
- Park 649 = 2%
- Total 39,241 = 100%
Local Roads don’t get enough funding from the Transportation Trust Fund
Local roads (county and municipal) carry over 50% of the traffic in New Jersey every day. Presumably, at least 50% of the fuel consumed in New Jersey is used while driving on local roads. Thus 50% of the fuel taxes are generated by vehicles travelling on local roads. Why isn’t 50% of the fuel tax revenue distributed to municipal and county governments to maintain their respective portions of New Jersey’s transportation network. Unfortunately, Governor Christie doesn’t believe that municipal and county governments are deserving of a share of the fuel taxes collected.
State and Federal Aid to Municipalities and Counties
Since 2009, annual allocations of $78.75 million each have been made for County and Municipal road repairs. The counties have also received $25 million annually for bridge maintenance (a task that is predominantly a county responsibility). Counties also get a much larger share of federal aid – $140 million annually, while municipalities get only $10 million annually.
Unfortunately for municipal governments, this cost sharing formula does not reflect the actual cost to maintain New Jersey’s Municipal Road network. Ideally, municipal and county governments should receive sufficient state and federal funding so that the portion of road repair costs financed through property taxes is similar.
Property Tax Distribution Rates
The New Jersey Department of Community Affairs reports that the state’s 2015 property taxes were distributed as follows:
- School Taxes 52.3%
- County Taxes 18.1%
- Municipal Taxes 29.6%
While the ratio of Municipal to County Road Mileage is 4.56 to 1, the ratio of Municipal to County tax levies is only 1.64 to 1.
Potential Cost Sharing Alternatives
Cost Split based upon Road Mileage
One option would be to apportion TTF local aid revenues between counties and municipalities based upon the length of roads within each jurisdiction, or:
- 81% for municipalities
- 19% for counties.
County Freeholders, Engineers and Executives would likely argue that such an allocation of funds was unfair – since county roadways are often wider and carry greater daily traffic volumes than do municipal streets. Such factors increase construction costs and the needed frequency of road repairs.
Cost Sharing Considering Traffic Volumes and Weighted Road Mileage
It may, therefore, be fairer to establish a method of sharing local aid that considers traffic loads as well as roadway length and also gives county roads a mileage bonus to account for their greater average width.
In this alternative, each of these two components for the sharing of local aid – Traffic and Weighted Mileage is used to allocate one half of the local aid funds.
Traffic Sharing Factor
- 50% County, and
- 50% Municipal
Weighted Mileage Sharing Factors (Using an allowance for the average county road being 40′ wide versus 30′ average width for municipal roads)
- Municipal Mileage Factor (MMF) = Municipal Miles/(1.33*County Miles + Municipal Miles) = 29,408/37,985 = 77%
- County Mileage Sharing Factor (CMF) = 1.33*County Miles/(1.33*County Miles + Municipal Miles) = 8,577/37,985 = 23%
Local Aid Sharing Formula based upon both Traffic and road inventory
- County Share = (Traffic + CMF)/2 = (50% + 23%)/2 = 36.5%
- Municipal Share = (Traffic + MMF)/2 = (50% + 77%)/2 = 63.5%
This proposal would:
- Provide immediate property tax relief,
- Help to support adequate municipal road repairs, and
- Distribute fuel tax revenues evenly over roads that were used to generate them.
What do you think?
NJ Infrastructure Maintenance – Who’s Responsible?, Immune?, Liable?
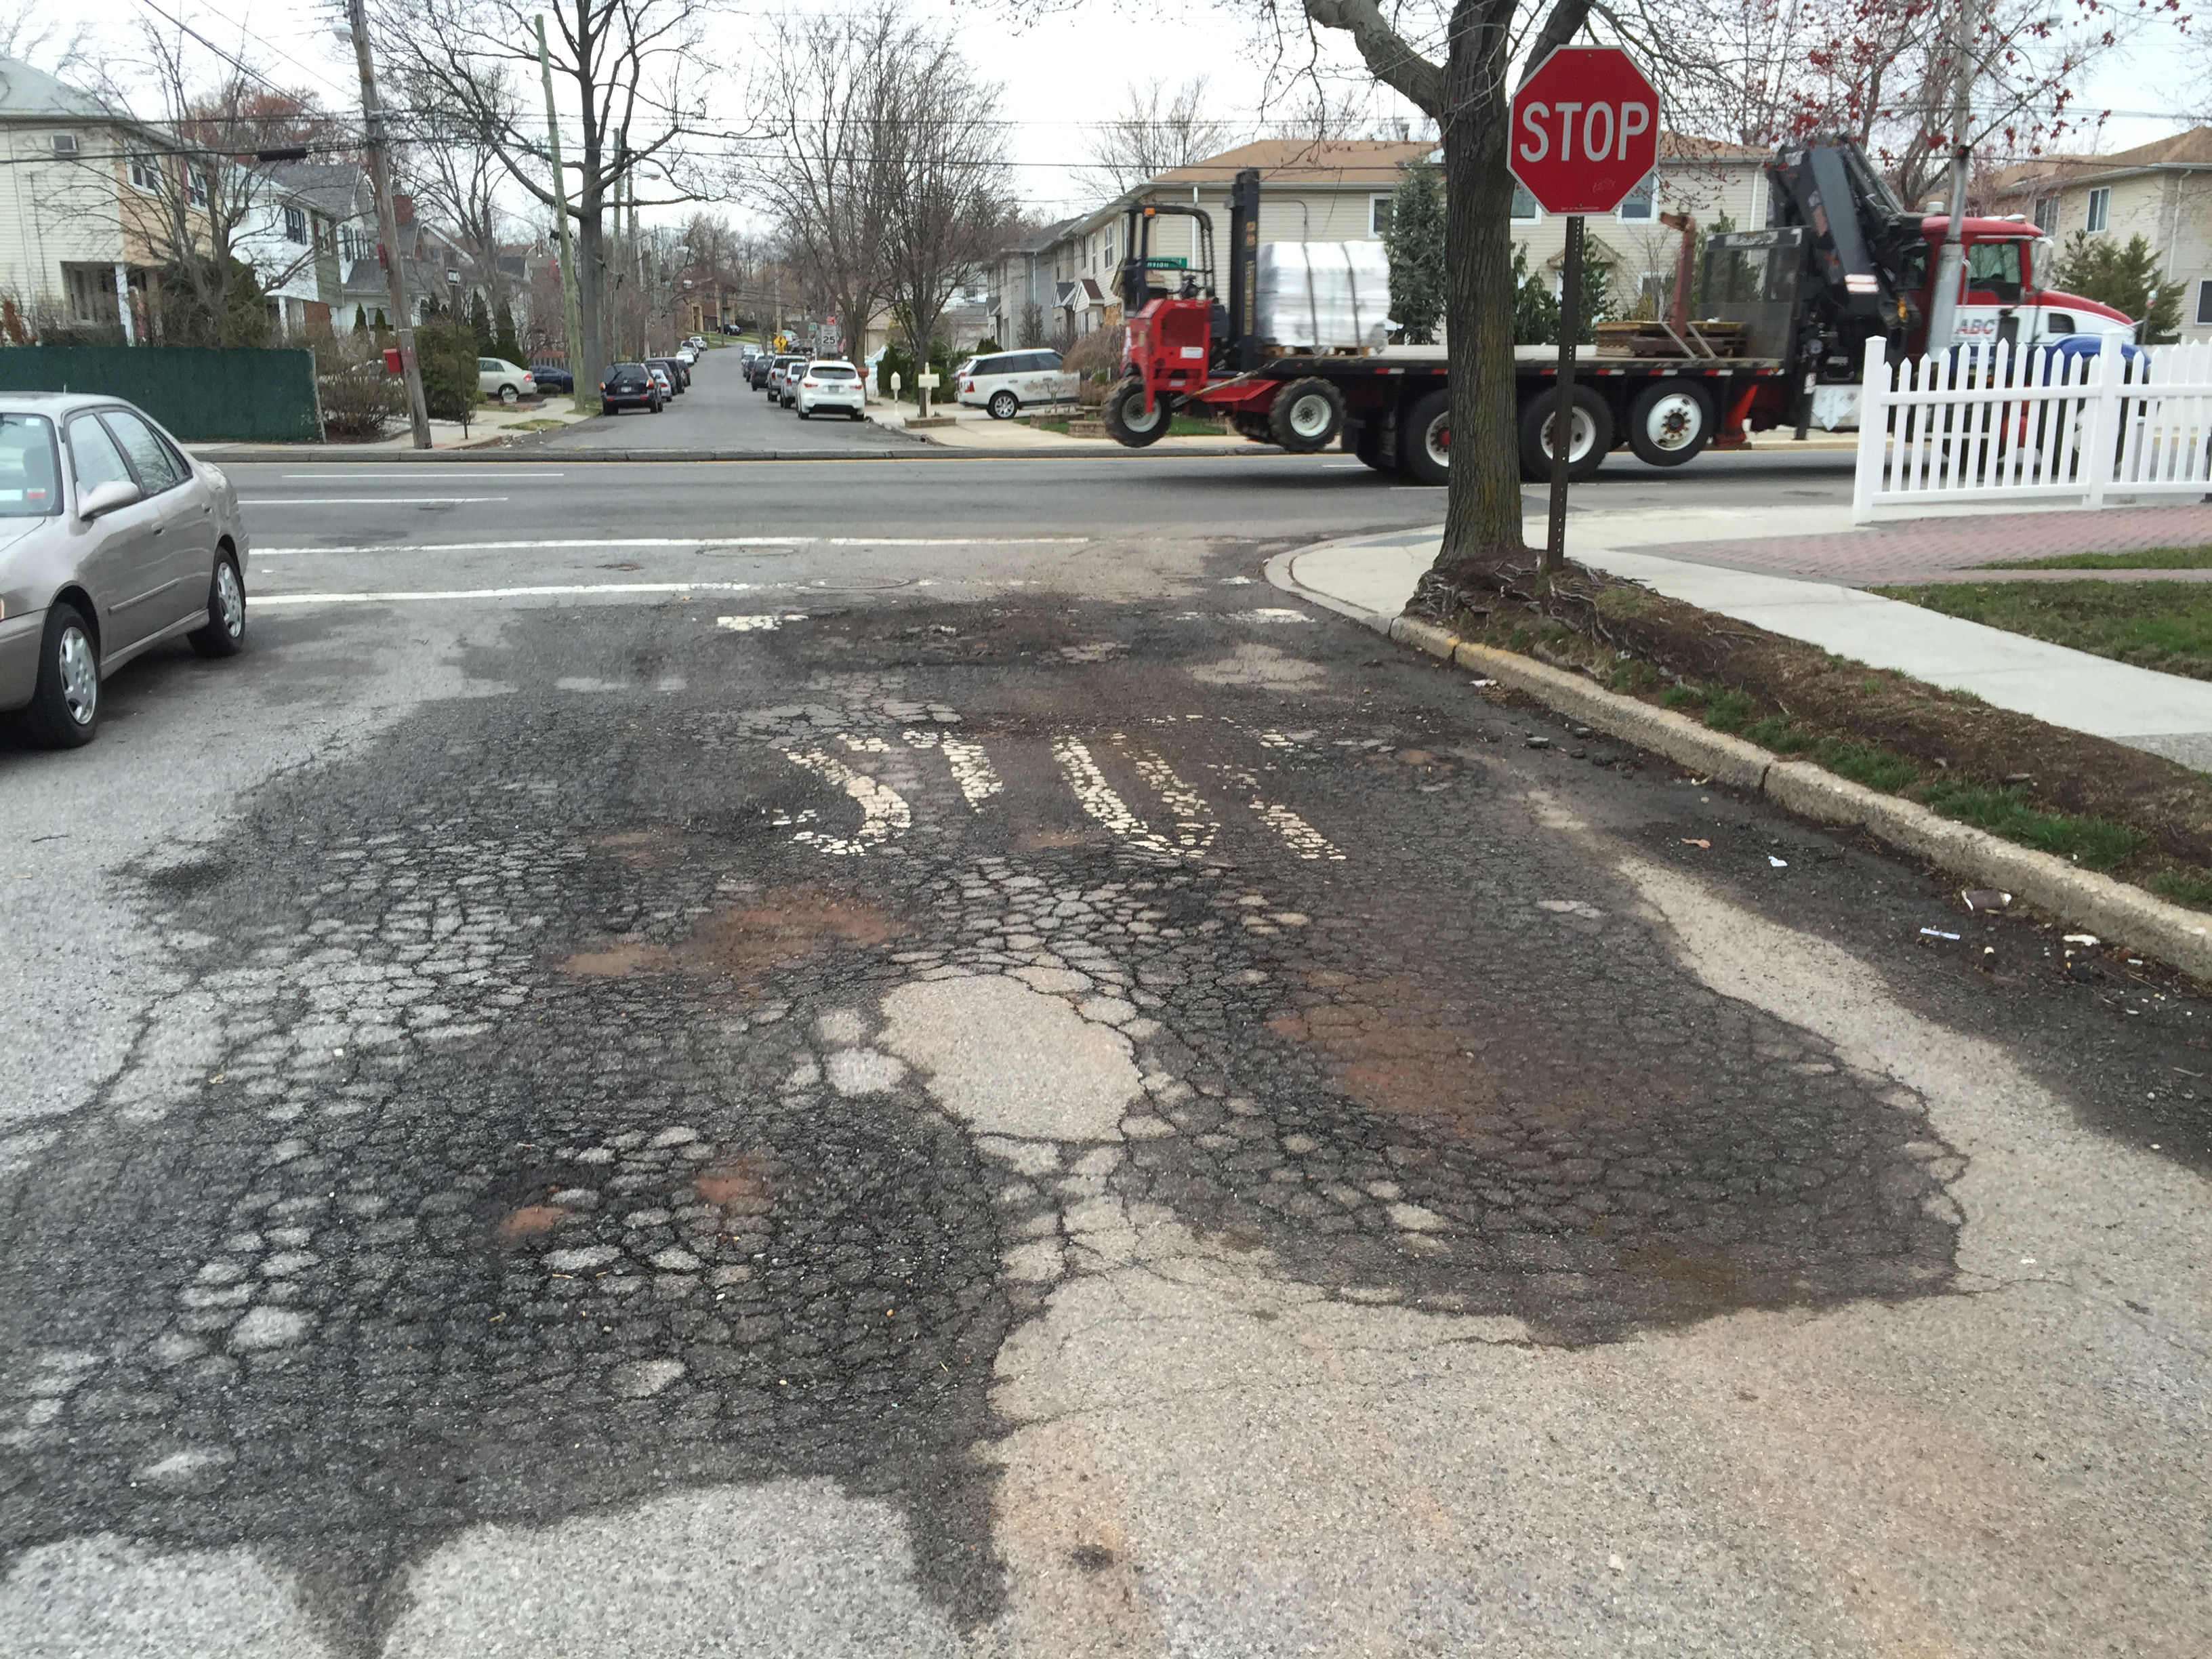
Freeze/thaw pavement damage
Annual NJ Infrastructure Maintenance Demands
As the snow melts, and we enter spring, it’s likely that Municipal Engineers will discover an array of problems to fix, within the boundaries of public streets – from huge potholes – to curbs, broken by errant snowplows – to cracked, spalled or heaved sidewalks. How do we prioritize the repairs and sort out who is responsible for making them? Undoubtedly, we want to correct the problems before someone gets hurt and the municipality we work for is sued.
Public Entity Immunity
Infrastructure maintenance including pavements, drainage systems, curbs and sidewalks in public streets is an ongoing challenge for municipal engineers who are attempting to stretch their transportation funding while avoiding costly litigation. When an individual is injured within a New Jersey public right-of-way, The New Jersey Tort Claims Act, N.J.S.A. 59: 1-1 et seq., provides some immunity to local governments – that immunity is not absolute.
New Jersey Statutes 59:2-1 provides the following general immunity for public entities:
A public entity is not liable for the exercise of discretion when, in the face of competing demands, it determines whether and how to utilize or apply existing resources, including those allocated for equipment, facilities and personnel unless a court concludes that the determination of the public entity was palpably unreasonable. Nothing in this section shall exonerate a public entity for negligence arising out of acts or omissions of its employees in carrying out their ministerial functions.
Public Entity Liability
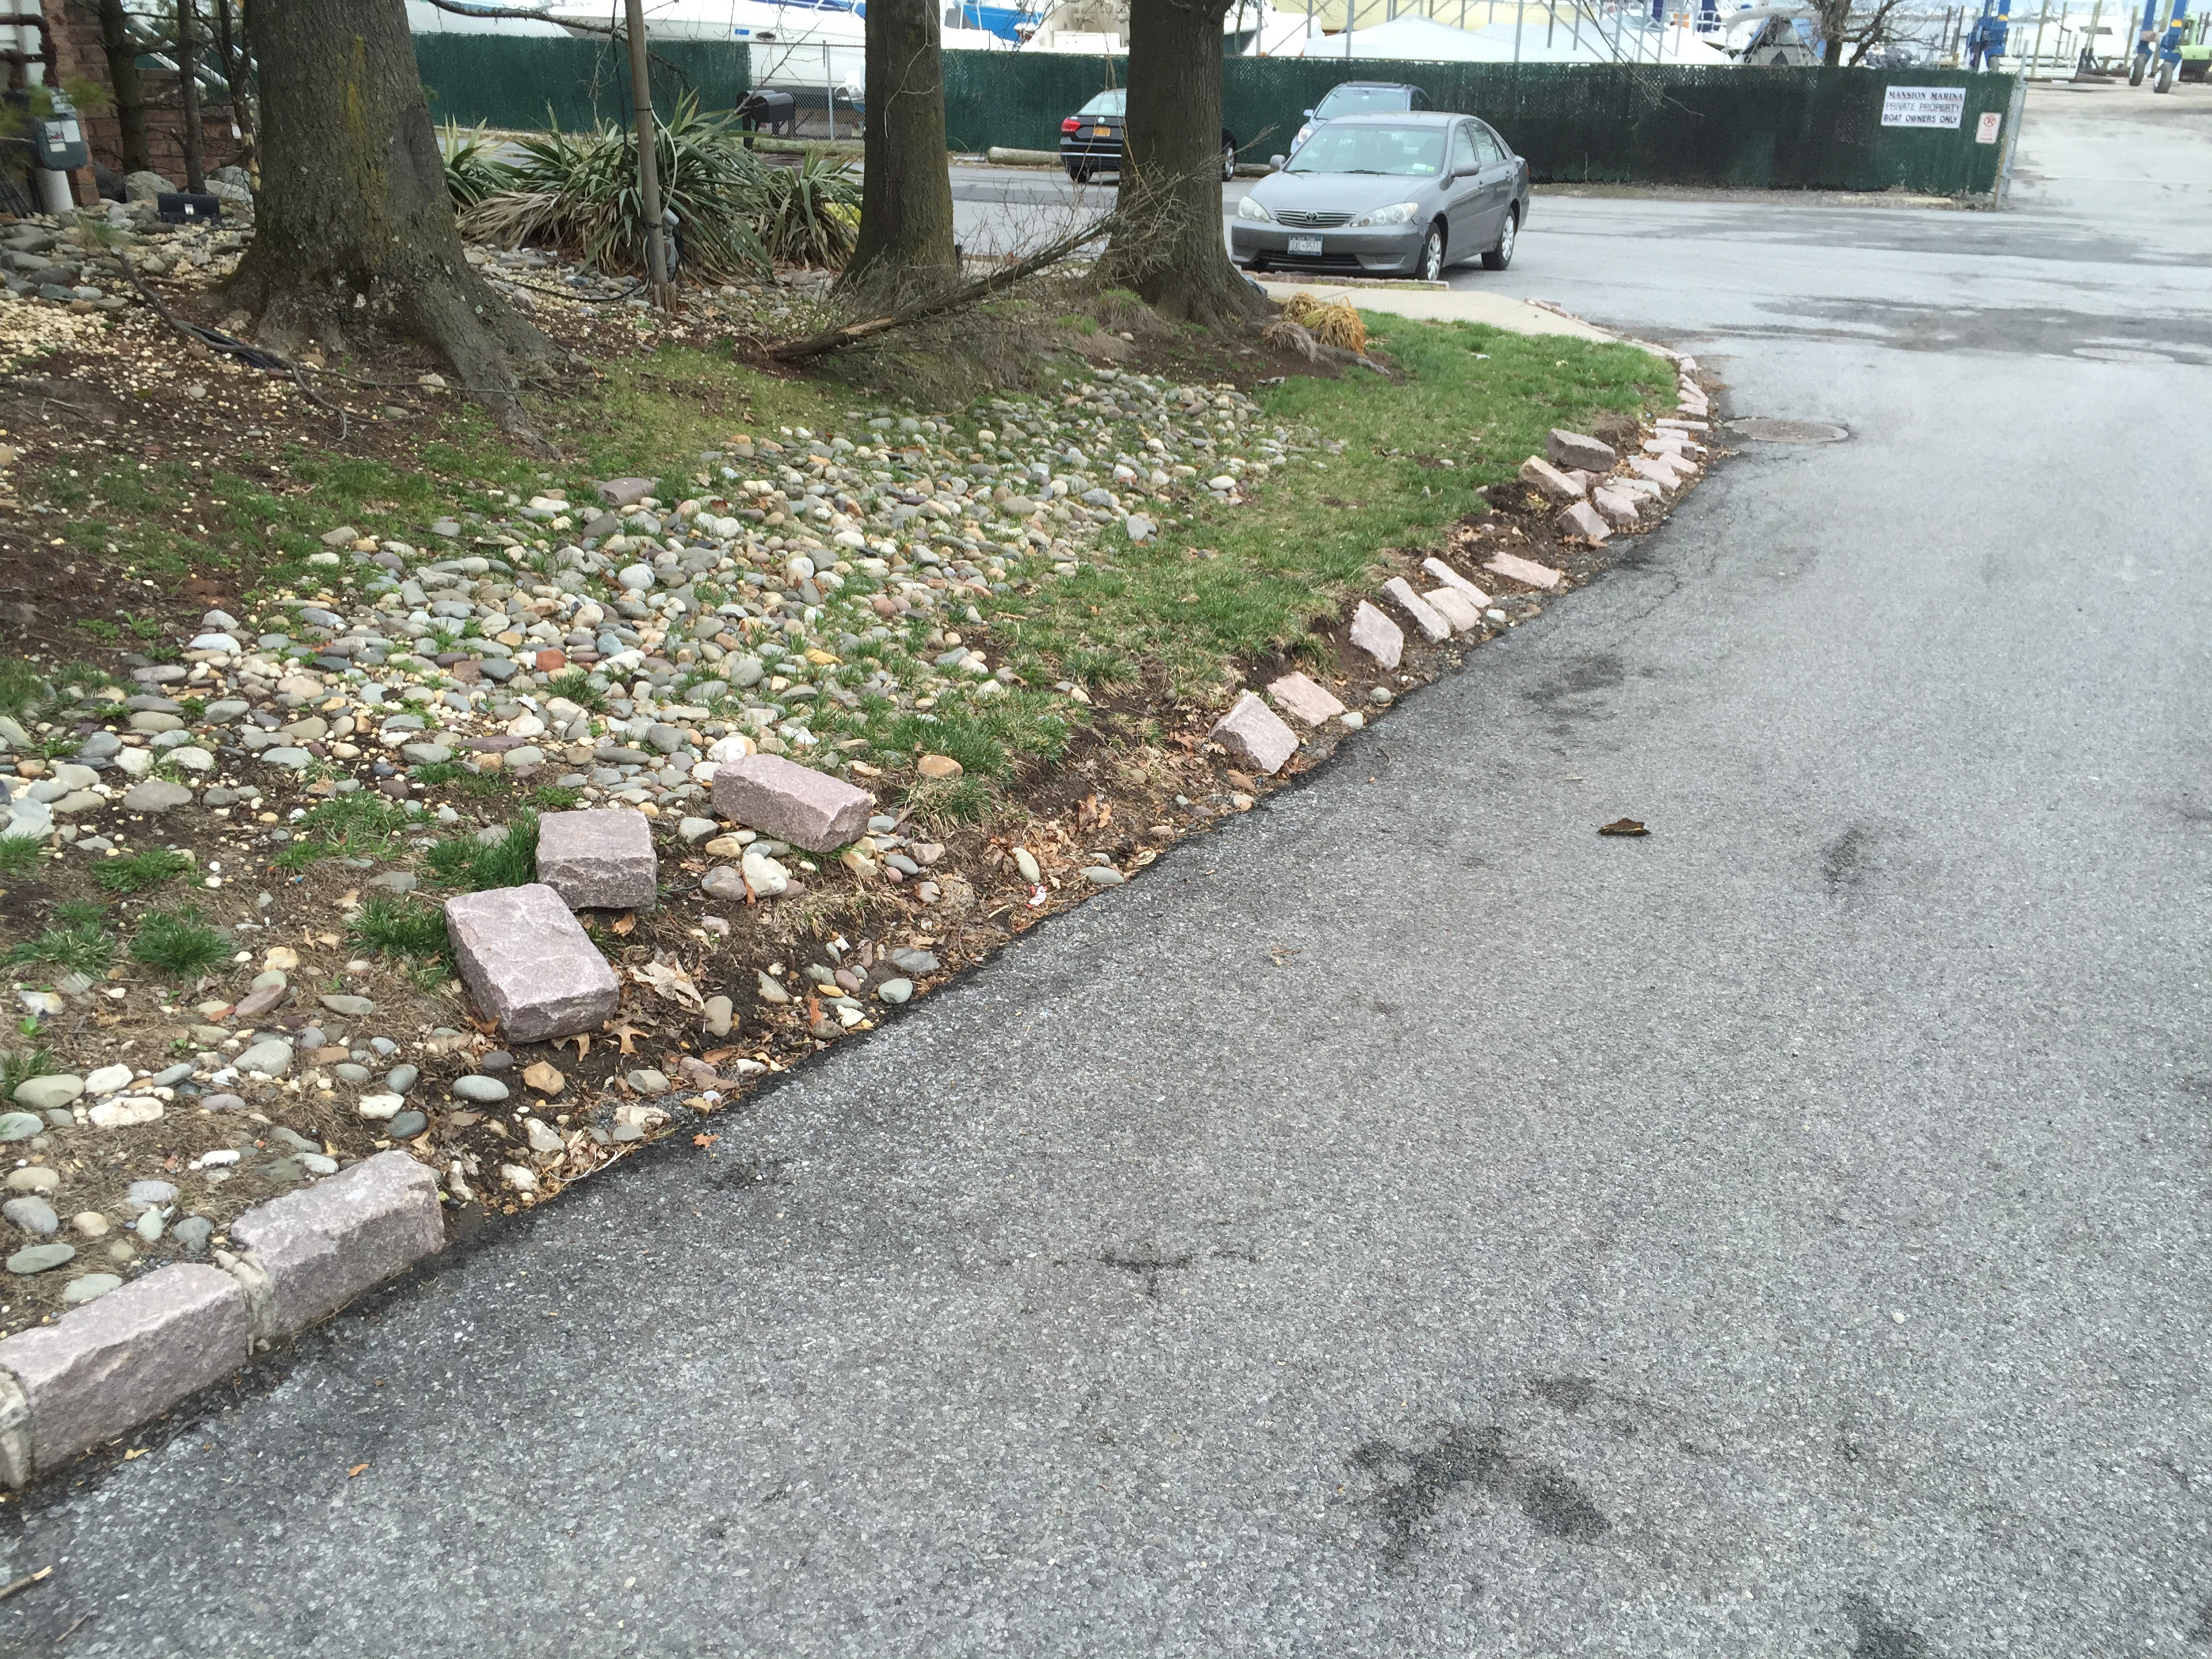
Curb Damaged by Snow Plow
Note that N.J.S.A. 59:2-1 requires that the entity make a determination about the allocation of limited resources and that the determination was not “palpably unreasonable”. In other words, obviously unwise, plainly absurd or patently foolish. What about a complete failure to act? Does a municipal entity have an obligation to understand what the competing demands for resources are – before allocating limited funding? I think, that a good argument could be made, that it does.
Also note that immunity is not provided to a public entity for negligence arising out of the performance of “ministerial duties” – functions that demand no judgment or discretion. Is filling a pothole a ministerial function? How about replacing a missing stop sign or manhole cover? What about repairing a broken sidewalk or curb?
New Jersey Statutes 59:4-2 establishes general public entity liability, as follows:
A public entity is liable for injury caused by a condition of its property if the plaintiff establishes that the property was in dangerous condition at the time of the injury, that the injury was proximately caused by the dangerous condition, that the dangerous condition created a reasonably foreseeable risk of the kind of injury which was incurred, and that either:
- a negligent or wrongful act or omission of an employee of the public entity within the scope of his employment created the dangerous condition; or
- a public entity had actual or constructive notice of the dangerous condition under section 59:4-3 a sufficient time prior to the injury to have taken measures to protect against the dangerous condition.
Nothing in this section shall be construed to impose liability upon a public entity for a dangerous condition of its public property if the action the entity took to protect against the condition or the failure to take such action was not palpably unreasonable.
So, the public entity can be liable, not only if had notice of a dangerous situation – but also if it had constructive notice of the dangerous condition. A public entity will be deemed to have constructive notice “if it had actual knowledge of the existence of the condition and knew or should have known of its dangerous character.” Thus a plaintiff simply needs to establish “that the condition had existed for such a period of time and was of such an obvious nature that the public entity, in the exercise of due care, should have discovered the condition and its dangerous character.”
Maintaining Immunity
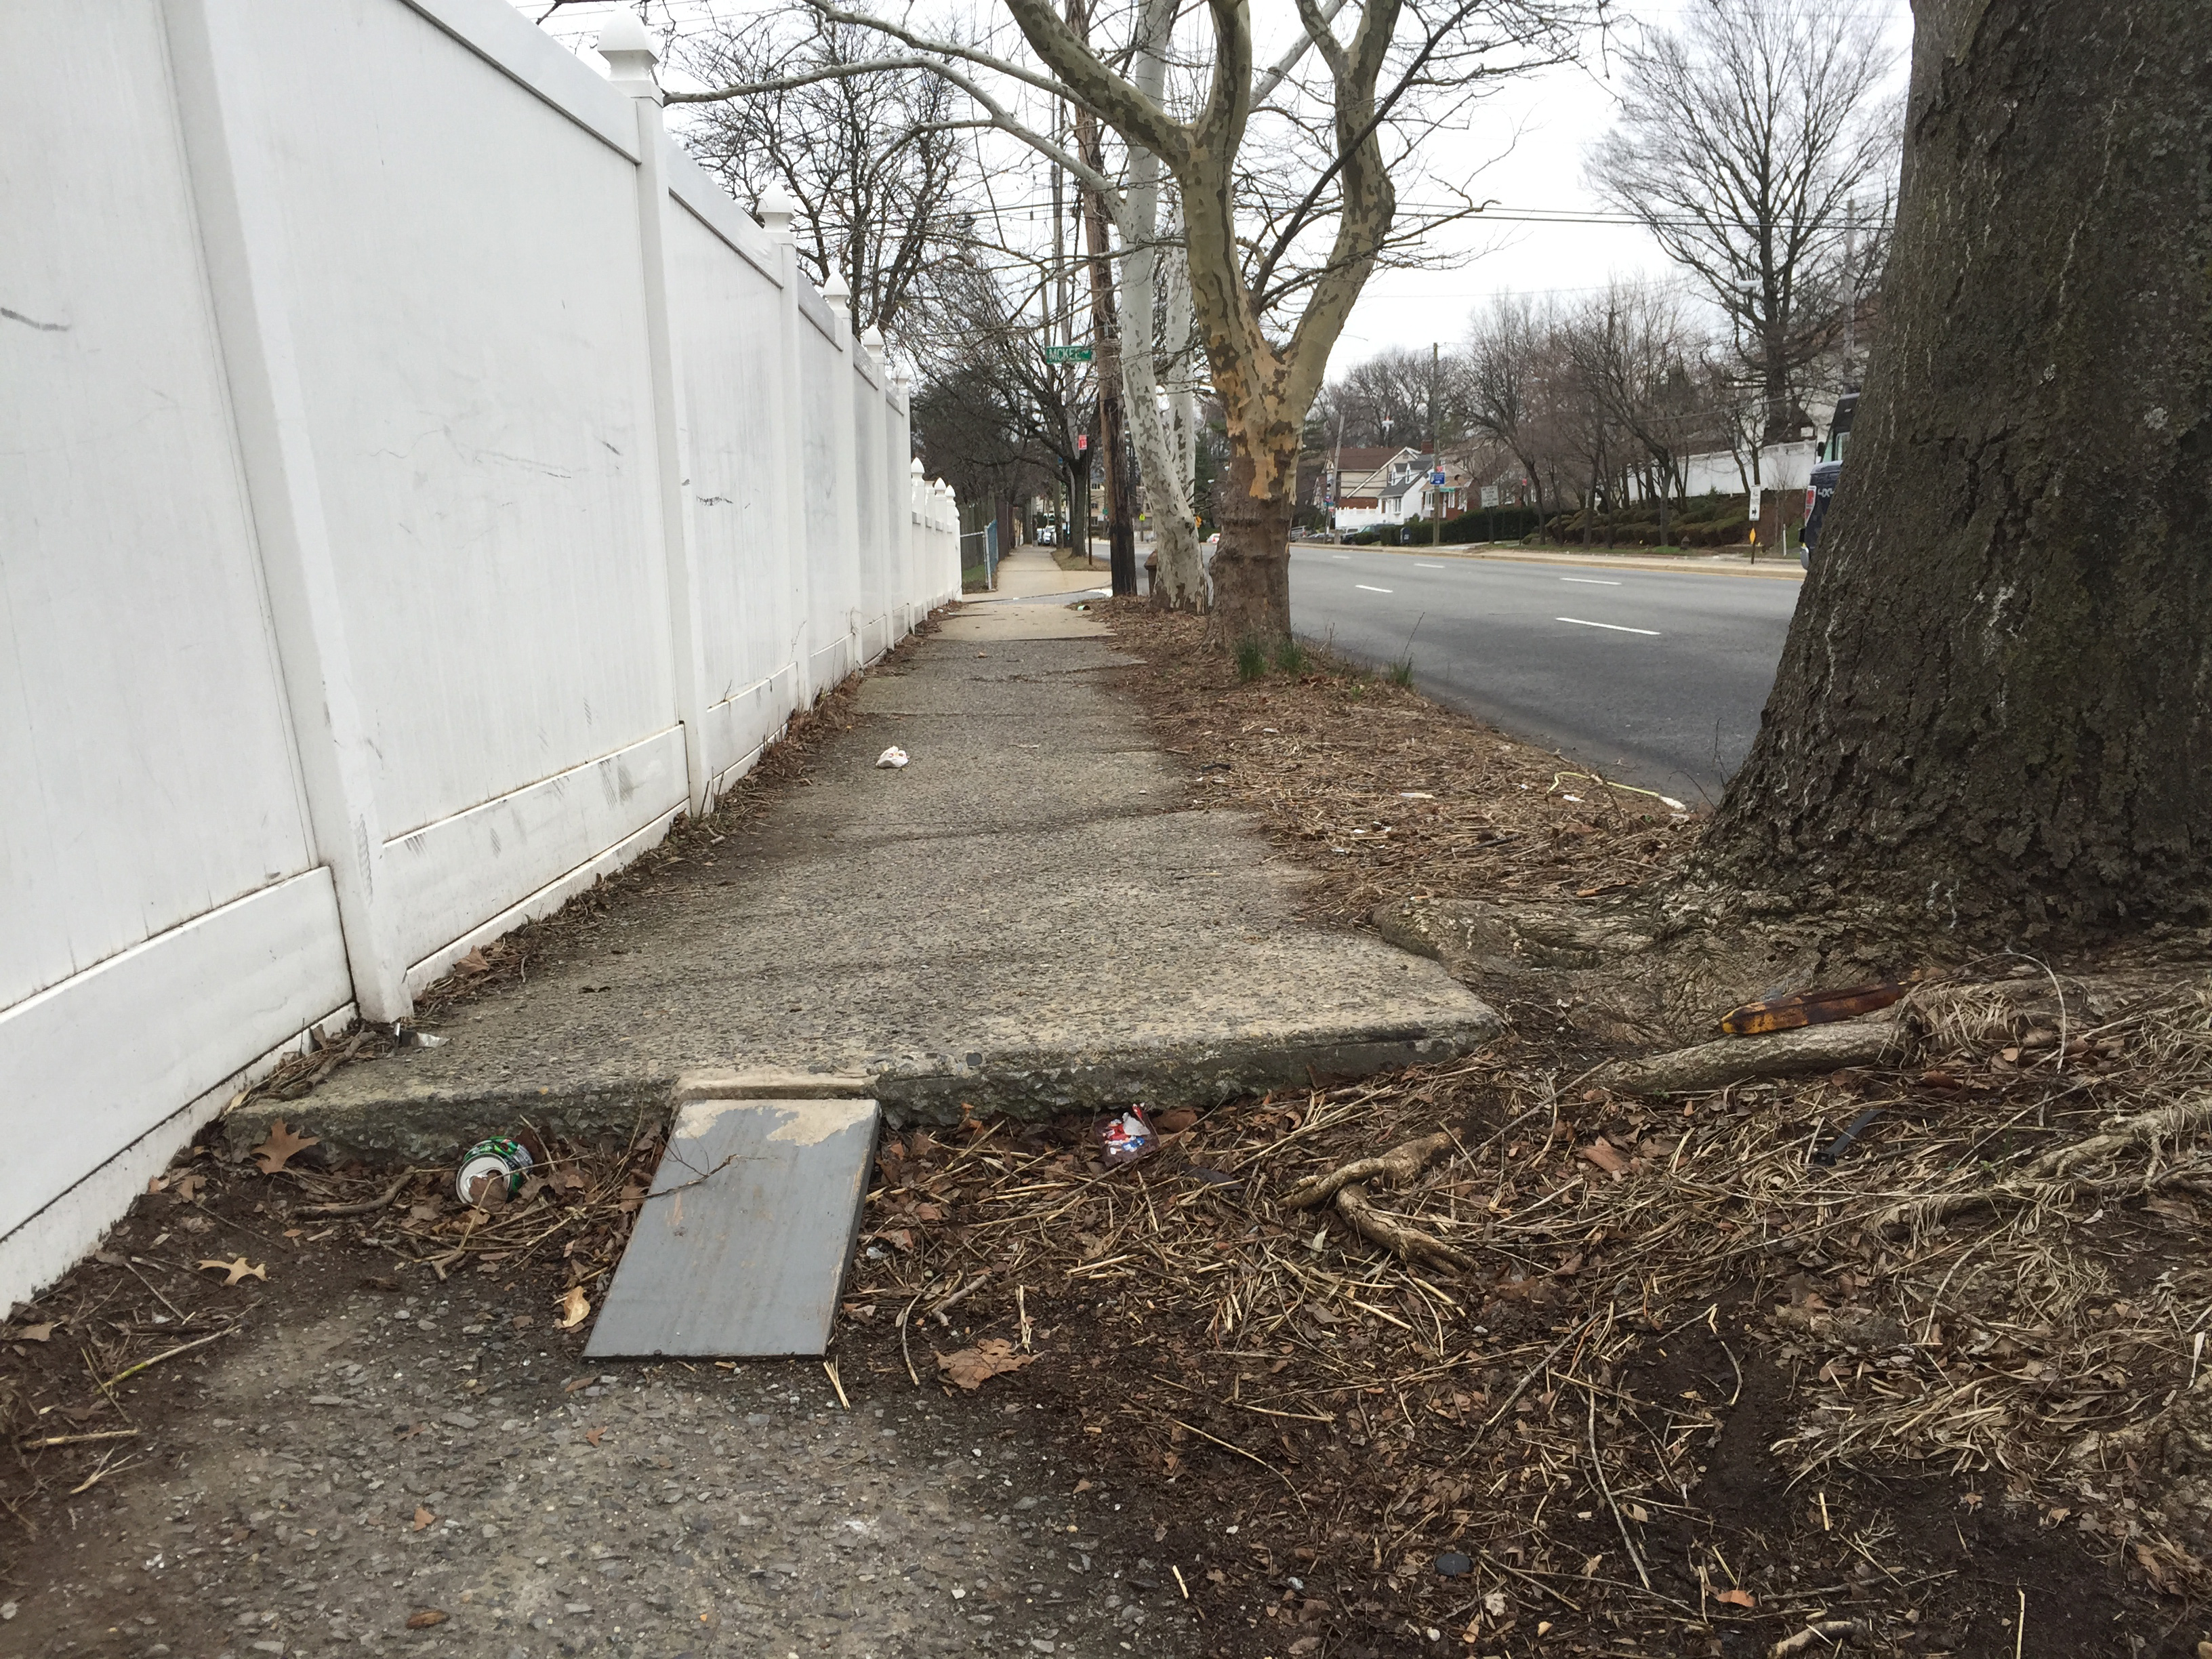
Sidewalk Raised by Tree Roots
So — how can municipalities behave to protect against the loss of protection provided by the Tort Claims Act?
Certainly, it’s far better to minimize the potential for accidents by maintaining curbs, sidewalks, pavements, drainage systems, traffic control systems and other facilities in good condition. Unfortunately, given budget constraint, this goal is seldom achievable. Therefore, it’s important to:
- First – define the municipal responsibility for infrastructure maintenance;
- Next, – develop a method to prioritize the order of work.
Determining Responsibility
When considering who is responsible to maintain infrastructure within the public right of way, a few questions immediately come to mind.
- Whose right-of-way is it? – State? – County? – Municipal? – Other?
- What are the limits of jurisdiction at intersections?
- What part of the roadway is it?
- Pavement
- Curb
- Sidewalk
- Curb ramp
- Traffic Control Device
- Utility and Street Hardware
- Does the abutting property owner have a responsibility?
- Curb installation or repair
- Sidewalk installation or repair
- Wheelchair ramp installation or repair
- Driveway apron installation or repair
- Who has an obligation to inspect for hazards?
- State?, County?, Municipality?, Property Owner?, Utility Company?, Other?
- If a municipal responsibility, who is charged with making the inspections?:
- Municipal Engineer
- Code Enforcement Official
- Public Works Director
- Police Department
- Other
- What standard is used to determine if a defect is hazardous?
- Who determines if, and when, an observed defect should be fixed?
- How is maintenance funded?
- Annual Operating Budget
- Capital Budgets and bonding
- Grants
- Property Owner Assessments
- Other Private Sources
I hope to explore these matters in more detail in future articles. Please provide me with your comments or suggestions about how to address these and other municipal engineering, code enforcement and alternative dispute resolution issues.
The author, Carl E. Peters is one of fewer than 10 people licensed by the State of New Jersey as a Professional Engineer, Professional Land Surveyor, Professional Planner, Construction Official, Building Subcode Official and Plumbing Subcode Official. He is also a Certified Municipal Engineer and Mediator and founder of Carl E. Peters, LLC
New Handicapped Accessibility Design Tools
The United States Access Board has prepared computer animations to help designers understand the reasons for the standards that have been established for wheelchair maneuvering, wheelchair maneuvering at doorways, accessible toilet rooms and accessible bathing facilities.
While it is important for designers of handicapped accessibility improvements to follow the code that is enforced in the jurisdictions of their projects, it’s often helpful to know why a regulation exists rather than simply following the letter of the code. I find this to be especially important when trying to retrofit existing buildings to make them accessible for wheelchair users.
These videos can be also helpful for building owners who wish to improve the handicapped accessibility of their homes or businesses but are concerned about costs and don’t wish to embark on a project which is larger and more complicated than absolutely necessary.
Building owners may also benefit by viewing these videos before performing maintenance on their premises. Often, changes made years after a new building has been approved and occupied (e.g. non-compliant faucets, door hardware, toilet paper and towel dispensers and objects places in required floor spaces) render it inaccessible. Owners of commercial buildings that fail to be in compliance with the standards set forth in the Americans with Disabilities Act are open to being sued and may be responsible to pay the costs of legal and expert witness fees along with the cost of fixing the problem.
If you are interested in watching the computer animations prepared by the U.S. Access Board, simply click on the highlighted text.
Please let me know if you find this information helpful.
")

Wheelchair maneuvering at doorways,


Accessible bathing facilities.
New Jersey Population Trends – North, South and Central 1840 – 2010

The three regions of New Jersey as defined to develop the charts in this post
I’ve been pondering the differences between North Jersey, South Jersey and even Central Jersey for some time now. The more I look into the matter the more questions I have. It doesn’t seem enough just to identify regions and their differences but rather also to ask why the distinctions came to be.
In my last post, “Possibly the Split is East Jersey,West Jersey, not North Jersey, South Jersey“,I discussed the origins of two Jerseys — East and West — during Colonial times. East Jersey related more to the Hudson River and New York, while West Jersey identified more with the Delaware River and Philadelphia. Transportation by water – especially the movement of goods – was essential to the development of the area. In the east, development thrived along the west bank of the Hudson River, Kill Van Kull and Arthur Kill. Camden, Trenton and Burlington grew along the east bank of the Delaware Bay (and River) from the Atlantic Ocean to the falls near Trenton where the river was not navigable. The population along the Atlantic shoreline was sparse due to the lack of safe harbors and anchorages for sailing vessels. It wasn’t until about the end of the first quarter of the 19th century that a maritime connection was made between the upper Delaware River and New York — the Morris Canal. At about the same time, the Delaware and Raritan Canal opened providing a shortcut between New York and Trenton and Philadelphia.

Statistics for New Jersey Counties with a population density of less than 500 persons per square mile.
One of the distinctions often made between North Jersey and South Jersey is that “North Jersey is more crowded”. While that may be true of some of the North Jersey counties, it’s not true for all. Some of the Counties that I have described as belonging to North Jersey have population densities that are remarkably similar to other counties in the most southern part of the state. It seemed to me that Jersey population trends warranted some looking into. I started by reviewing the New Jersey County Statistics that I had gathered for my first post “Where am I — North Jersey, South Jersey, or Possibly Even Central Jersey?” What I discovered was that some of the counties in North and Central Jersey had population densities as low or lower than those in the very southern portion of the state. The following table shows that seven counties have population densities of under 500 persons per square mile. So if the common wisdom “North Jersey is more densely populated than South Jersey” is not completely accurate, what else may we determine about New Jersey by the way its population has changed? What were the changes anyway?

Graph of New Jersey Population Changes by Region from 1790 – 2010
Luckily, I didn’t need to tabulate all of the New Jersey population data myself. I first came upon New Jersey Population Trends 1790 – 2010 — a nifty excel spreadsheet created by none other than the NJ Department of Labor. From this data I was able to develop the graphs below, which portray the New Jersey population changes by region and the regional changes by county. The first graph shows that the North Jersey population grew earlier than that of either South Jersey or Central Jersey, who maintained similar growth patterns until about 1860 (although the Central Jersey population was slightly higher), when Central Jersey’s growth rate increased at pace that has exceeded South Jersey through the latest census. North Jersey expanded the most quickly beginning in the mid-19th century and continuing until about 1960 when its population dipped for approximately twenty years. The North still leads in population but Central Jersey continues to narrow the gap.

Graph of New Jersey Population Variations in North, South and Central Regions
The second chart shows the regional trends in New Jersey population as a percentage of the total number of people living in the state. At the time of the first census the three regions claimed similar portions of the state’s residents – North and Central Jersey with approximately 35% and South Jersey with almost 30%. Almost immediately, North Jersey’s population took off while the South and Central Jersey shares of the pie declined. The disparity reached its peak in the early part of the 20th century when Central Jersey began to close the population gap. South Jersey has not kept pace with the other regions and now contains only 20% of the New Jersey population. That, of course doesn’t tell the complete story — growth within the regions was far from uniform — creating a need in me to develop additional graphs.
The graphs that follow show changes in population by county from 1790 – 2010. I’ve grouped them by region in the hope that the display of information would be clearer. Please note that the county population data prior to the 1860 census is not completely accurate (sufficient, I believe, for this discussion), as it has not been adjusted for the following jurisdictional changes.
- Warren County was incorporated in November 1824, from portions of Sussex County.
- Atlantic County was created in February 1837, from portions of Gloucester County.
- Passaic County was created in February 1837, from portions of both Bergen County and Essex County.
- Mercer County was founded February 1838, from portions of surrounding counties.
- Hudson County was formed from Bergen in 1840.
- Camden County was formed in March 1844, from portions of Gloucester County.
- Ocean County was established in 1850 from portions of Monmouth County except for Little Egg Harbor Township which seceded from Burlington County in 1891.
- Union County was formed in March 1857, from portions of Essex County.
I’ve left the evolution of the NJ County boundaries to be covered in a future post.

Graph of North Jersey Population 1790 – 2010
The seven North Jersey counties all had small populations until about 1830 when Essex County’s growth rate began to rise more quickly than the rest. Hudson County took off in 1850, its development going stride for stride with Essex County until the turn of the 20th century when Essex surged ahead for good – late bloomer Bergen County surpassed Essex County in total population in 1980. Hudson County, whose growth potential was limited by being the smallest county in land area (47 sq. mi.), remains on top of the list for highest population density (13,495 persons per sq. mi) having a density more than twice than of Essex County. Passaic County has grown quite steadily from the mid 19th century to the present while Morris County’s growth spurt waited until after World War II. By contrast, Sussex and Warren Counties have experienced a much lower increase in population than the rest of North Jersey.

Graph of Central New Jersey Population 1790 – 2010 by County
In Central Jersey, Midllesex, Mercer and Union Counties saw the earliest growth. Union County, part of Essex until 1857, took the lead in about 1900, to be surpassed by Middlesex County in about 1960. Monmouth County which had been in fourth place behind Mercer County moved up to third place in the early 1950’s and, in the 1970’s passed Union County for second place in Central Jersey. Ocean County’s growth started to skyrocket in the 1950’s bringing it into the third spot in 2010. As the largest county in area, Ocean still ranks in the bottom third of population density. Somerset and Hunterdon Counties have expanded at a more modest pace yet Somerset County has a population density similar to neighboring Morris County while Central Jersey’s Hunterdon County is as sparsely populated as Warren County in the North and Cumberland County far to the south.

Graph of South Jersey Population by County 1790-2010
In the early 1800’s Burlington County was the South Jersey population leader – not surpassed by Camden County until the 1870’s. Today Camden County is the most populated of the South Jersey counties and has a density of almost twice that of runner-up GloucesterCounty. Atlantic County was quite sparsely populated until the late 1800’s. It currently has a population similar to that of Gloucester County, which did not see significant growth until the 1950’s. The most Southern Jersey Counties – Salem, Cumberland and Cape May have not experienced the population growth of the rest of the South Jersey region. In fact, Salem County’s population density of 196 persons per square mile is less than 70% of that of Sussex County, the second most sparsely populated county in New Jersey.
Why did the counties of the State of New Jersey develop at such different rates? What factors played a role in more rapid growth:
- Transportation?
- Sources of power for industry?
- Proximity to New York and/or Philadelphia?
- Natural and recreational resources?
Possibly the split is East Jersey, West Jersey not North Jersey, South Jersey

Map of East and West Jersey 1686 and 1700 by John P. Snyder
New Jersey has been split since Colonial times – In fact, the splitting occurred precisely at the time this piece of geography became known as New Jersey. The great divide was not, however, between North Jersey and South Jersey; it was between East Jersey and West Jersey.
In March 1664, King Charles II of of England deeded land, including the area that would become New Jersey, to his brother James Duke of York (who would later become King James II). James, in turn, made grants to his friends Sir George Carteret and John, Lord Berkeley – Carteret getting the East and Berkeley the West. The area that would become known as New Jersey in honor of Carteret’s defense of the Isle of Jersey in the English Channel.
I stumbled upon this fact many years ago when I located a book in the bargain bin at the Rutgers University Book Store and made it mine for the sum of three dollars. This book The Story of New Jersey’s Civil Boundaries 1606 – 1968 by John P. Snyder was published by the Bureau of Geology and Topography in 1969. It was dedicated to the Land Surveyors of New Jersey by Robert A. Roe, Commissioner of the Department of Conservation and Economic Development (yes conservation and development were linked until 1970 when NJDEP came into being), who would eventually move on to Congress (and later have a federal building and a highway named for him). While this book languished on my bookshelves for many years and many moves I knew it would one day come in handy. While Mr. Snyder helped to launch me on my quest for the truth about these ancient New Jersey rivalries, I also found invaluable information from Rutgers University Library, the New Jersey State Archives, NOAA’s Historical Charts and Bob Barnett’s extremely informative website, westjersey.org.

Map of NJ Counties in 1710 by J Snyder
It seems that in March 1674, a mere ten years after receiving the grant, Lord Berkeley sold his half interest in New Jersey to John Fenwick who would in turn convey over nine tenths of West Jersey to a group headed by William Penn. In July 1674 the Duke of York issued a patent for East Jersey to Sir George Carteret which granted him the part of New Jersey north of a line connecting Barnegat Bay to Pennsauken Creek at the Delaware River- a line that would come into almost immediate dispute.
Over in East Jersey in the 1660’s the Governor had been busy handing out patents – First for Elizabeth -Town ( Dec. 1664) which would quickly cut off Woodbridge which would split further to create Piscataway – later for Middletown and Shrewsbury (1665). In 1668 Bergen Township was chartered having begun its European existence as part of the Dutch settlement of New Amsterdam. By 1675 four counties had been created around the lines of development – these would be named Bergen, Essex, Middlesex and Monmouth in 1683.
In 1676 Carteret entered into the Quintipartite Deed with the West Jersey Proprietors which established the boundary line between East Jersey and West Jersey as a line starting from the coast at Little Egg Harbor to the point on the Delaware River where it reaches 41 degrees 40 minutes latitude. The Duke of York confirmed this line with a deed to the West Jersey Proprietors in August 1680. It wasn’t until 1687 that anyone got around to establishing the line with a boundary survey. In that year George Keith, Surveyor General for East Jersey, ran the line from Little Egg Harbor to a point on the South Branch of the Raritan River, where he stopped – probably because there was already a dispute as to where the line was established on the ground. This line was eventually resurveyed in 1743 by John Lawrence, also a surveyor from East Jersey. The Keith Line remains the dividing line between Burlington County and Monmouth and Ocean Counties. For a brief period of time (1668 – 1695) Governors Daniel Coxe of West Jersey and Robert Barclay of East Jersey agreed upon a boundary that followed the Keith Line to the Raritan River and then meandered in a northeasterly direction to the New York border. This line, which placed Sussex and Morris Counties in West Jersey, was abolished by the colonial legislature in 1719.

New Jersey 1714 -1775 by John P. Snyder
Of course in New Jersey nothing is easy. The dispute between East Jersey and West Jersey was complicated by the lack of agreement as to the location of the boundary between New York and New Jersey. In May 1719, a tripartite deed was signed by New York, East Jersey and West Jersey establishing the New York/ New Jersey line at a point more southerly on the Delaware River than New Jersey had claimed. Once the king’s commissioners completed the survey of the New York/New Jersey line in 1774, West Jersey looked to modify the East Jersey / West Jersey Line once again. That proposal was never adopted and the Lawrence line remained as the official dividing line between East Jersey and West Jersey. Of course the jurisdictional disputes between New York and New Jersey continued until the 1990’s when a disagreement about the status of Ellis Island was decided by the US Supreme Court.
This historical review provides me with a few new insights about the debate about “Are we in North Jersey or South Jersey?”
- By 1775, development was greatest near the large navigable waterways.
- Hudson River – East Jersey
- Delaware River – West Jersey – although development upstream of the falls near Trenton was not as rapid
- By 1775 Burlington, Gloucester, Salem, Cumberland and Cape May Counties were established as parts of South Jersey
- Hunterdon and Sussex Counties seemed to be more aligned with West Jersey due to their access to the Delaware River
- In 1775 Mercer County has no identity. It eventually was created in 1838 from parts of Hunterdon, Burlington and Middlesex Counties. Trenton didn’t become the state capital until 1790. This seems like an area with a potential identity crisis
- Ocean County didn’t exist in 1775 either and it’s a long sailboat ride to there from either New York or Philadelphia, anyway.
So, for the moment I’m sticking by my proposition that there are three distinct regions of New Jersey — ,North South and Central but I’m beginning to see the merits of the argument that the state is split in two – but North Jersey/ South Jersey I’m not convinced.
The author, Carl E. Peters is one of fewer than 10 people licensed by the State of New Jersey as a Professional Engineer, Professional Land Surveyor, Professional Planner, Construction Official, Building Subcode Official and Plumbing Subcode Official. He is also a Certified Municipal Engineer and Mediator and founder of Carl E. Peters, LLC
 D5 Creation