US Covid-19 Charts
Revised April 30, 2020
Chart Summary
The following charts have been compiled to provide some insight into how the coronavirus (Covid-19) is spreading throughout the United States. The charts have been grouped into the following categories:
- Cases per State
- Deaths per State
- Cases per 100,000 Population per State
- Deaths per 100,000 Population per State
- Rate of Increase of Covid-19 Cases per State
The first four chart categories show ten days of data and are arranged in four groups. The groups were set up in the descending order of cases per state (also including Puerto Rico and the District of Columbia) on April 18, 2020. The State of New York has been excluded from the Cases per state and Deaths per state charts due to the sheer magnitude of cases and deaths in that state. Excellent coverage of Covid-19 in New York is provided in The Gothamist.
These charts have been compiled using data from The Guardian and CNN who both cite their source of data as Johns Hopkins University & Medicine
Also See Politico and The COVID Tracking Project who provide detailed information of the number of people in each state that have been tested for the virus.
Covid-19 Cases per State
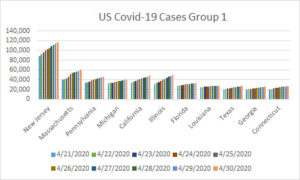
Covid-19 Cases in NJ, MA, PA, MI, CA, IL, FL, LA, TX, GA & CT from 4-21-2020 through 04-30-20
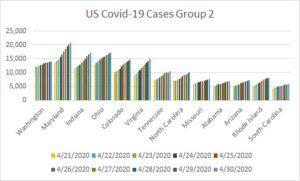
Covid-19 Cases in WA, MD, IN, OH, CO, VA, TN, NC, MO, AL, AZ, RI and SC from 04-21-2020 through 04-30-2020
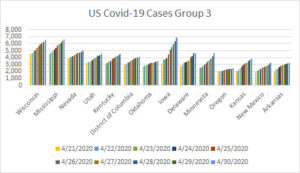
Covid-19 Cases in WI, MI, NV, UT, KY, DoC, OK, IA, DE, MN, OR, KS, NM and AR from 4-21-20 through 04-30-2020
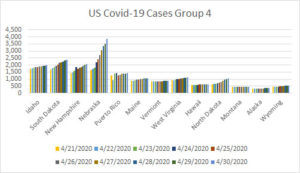
Covid-19 Cases in ID, SD, NH, NB, PR, ME, VT, WV, HI,, ND, MT, AK and WY from 04-21-2020 through 04-30-2020
Covid-19 Deaths per State
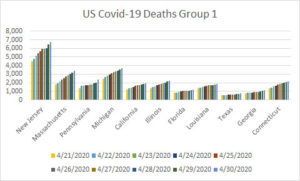
Covid-19 Deaths in NJ, MA, PA, MI, CA, IL, FL, LA, TX, GA & CT from 4-21-2020 through 04-30-20
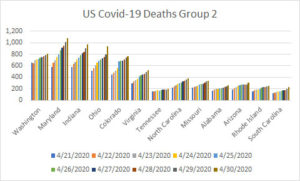
Covid-19 Deaths in WA, MD, IN, OH, CO, VA, TN, NC, MO, AL, AZ, RI and SC from 04-21-2020 through 04-30-2020
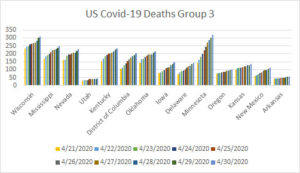
Covid-19 Deaths in WI, MI, NV, UT, KY, DoC, OK, IA, DE, MN, OR, KS, NM and AR from 4-21-20 through 04-30-2020
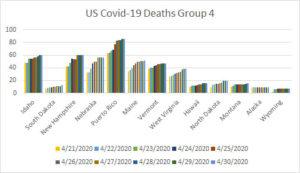
Covid-19 Deaths in ID, SD, NH, NB, PR, ME, VT, WV, HI,, ND, MT, AK and WY from 04-21-2020 through 04-30-2020
Covid-19 Cases per 100,000 Population by State
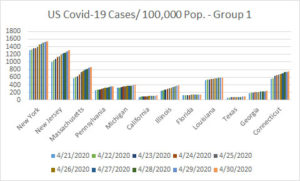
Covid-19 Cases per Capita in NJ, MA, PA, MI, CA, IL, FL, LA, TX, GA & CT from 4-21-2020 through 04-30-20
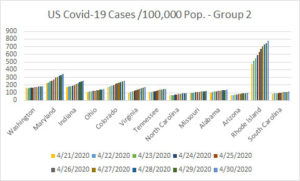
Covid-19 Cases per Capita in WA, MD, IN, OH, CO, VA, TN, NC, MO, AL, AZ, RI and SC from 04-21-2020 through 04-30-2020
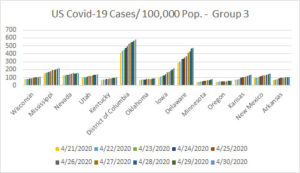
Covid-19 Cases per Capita in WI, MI, NV, UT, KY, DoC, OK, IA, DE, MN, OR, KS, NM and AR from 4-21-20 through 04-30-2020
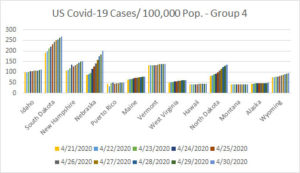
Covid-19 Cases per Capita in ID, SD, NH, NB, PR, ME, VT, WV, HI,, ND, MT, AK and WY from 04-21-2020 through 04-30-2020
Covid-19 Deaths per 100,000 Population by State
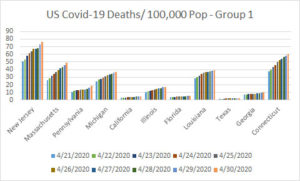
Covid-19 Deaths per Capita in NJ, MA, PA, MI, CA, IL, FL, LA, TX, GA & CT from 4-21-2020 through 04-30-20
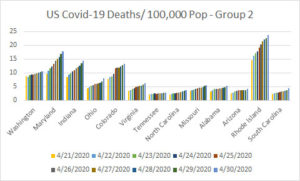
Covid-19 Deaths per Capita in WA, MD, IN, OH, CO, VA, TN, NC, MO, AL, AZ, RI and SC from 04-21-2020 through 04-30-2020
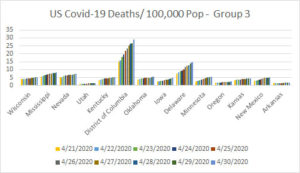
Covid-19 Deaths per Capita in WI, MI, NV, UT, KY, DoC, OK, IA, DE, MN, OR, KS, NM and AR from 4-21-20 through 04-30-2020
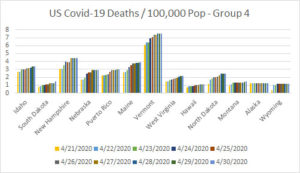
Covid-19 Deaths per Capita in ID, SD, NH, NB, PR, ME, VT, WV, HI,, ND, MT, AK and WY from 04-21-2020 through 04-30-2020
Rate of Increase of Covid-19 Cases
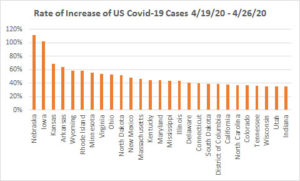
Weekly Rate of Increase of Covid-19 Cases – Top Group
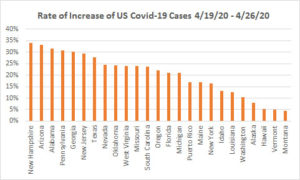
Weekly Rate of Increase of Covid-19 Cases – Bottom Group
About the Author
Carl E. Peters is a licensed Professional Engineer, Land Surveyor, Planner and Construction Official. His firm, Carl E. Peters, LLC, is located in Fords, NJ
 D5 Creation